Flow Health
Across a set of one or more teams, are they hitting their delivery goals right now — and what's the single strongest result and biggest risk across the whole set?
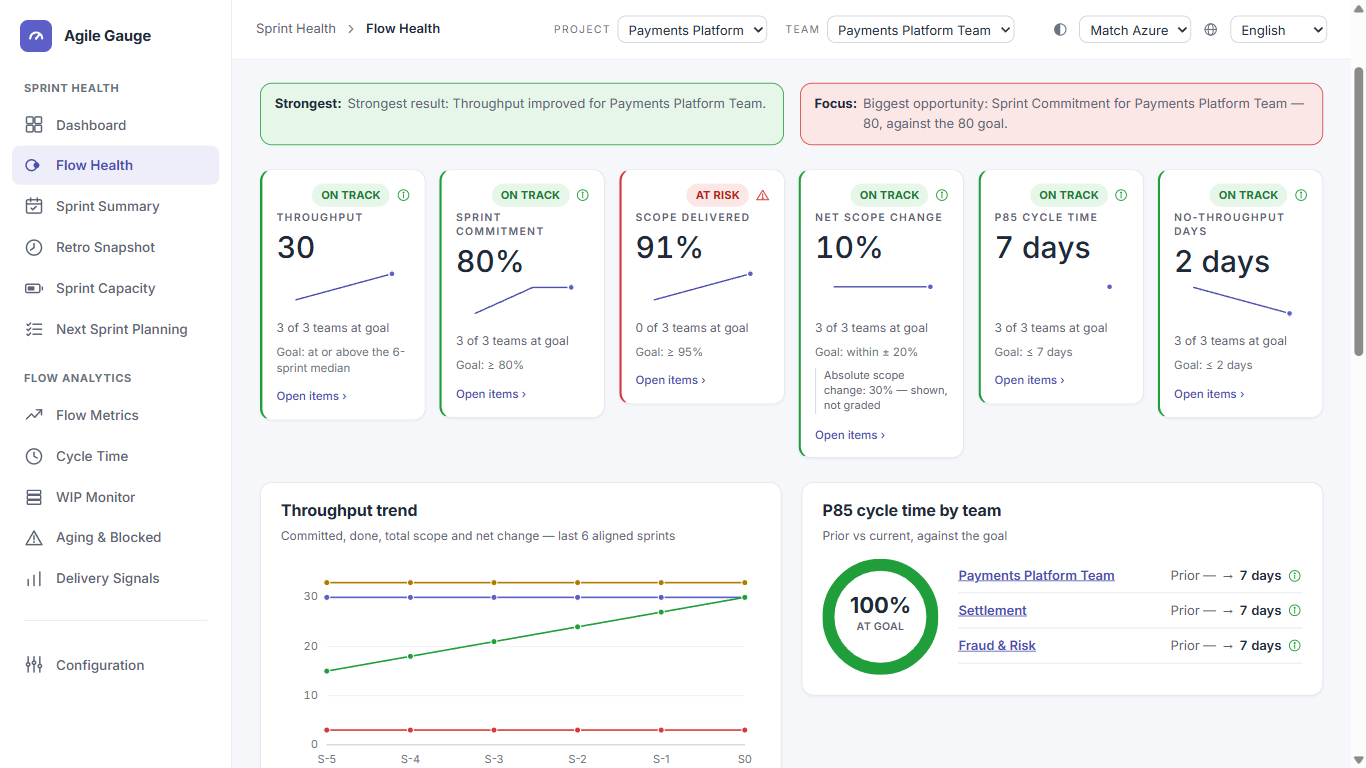
There is no single "Flow Health score"
Flow Health grades six KPIs independently, each landing on its own status. There is no blended overall number — think of it as six separate report cards, not one grade.
What you see
- A team-set picker, an "as of" toggle (Latest finished or Current), a Goals button and a Refresh button.
- A headline strip naming the strongest result and the biggest focus area across the set, when there's enough data to say.
- Six KPI tiles, always in this order: Throughput, Sprint Commitment, Scope Delivered, Net Scope Change, P85 Cycle Time, No-Throughput Days — each with a value, a status, and a sentence like "3 of 6 teams at goal."
- Four panels: Throughput trend (committed/done/total scope/net scope change over the last six aligned sprints), P85 cycle time by team, Throughput consistency, and SCC & scope change by team (a table with a CSV export).
- "What to celebrate" and "Where to focus next" — up to four cards each, naming a team and a KPI.
- "Right now" — the running sprint's Done / In Progress / Not Started counts for whichever team is selected in the hub's own top bar. This section always follows the top-bar team, independent of whatever team set is chosen above it.
How we calculate it
- Sprint Commitment (SCC)
- Day-1 committed items that finished, divided by the Day-1 committed count. Shown as "no baseline for this sprint" rather than a number when there's no real Day-1 snapshot to measure from.
- Scope Delivered
- Finished items divided by final scope — every item not removed, whether it was there on Day 1 or added later.
- Net Scope Change
- (Added − Removed) ÷ Day-1 commitment, as a signed percentage. A separate "absolute" scope-change figure (added + removed) is shown for context but is never graded.
- P85 Cycle Time
- The 85th-percentile cycle time (activated → closed, calendar days) for items finished in that single sprint. Needs at least 10 finished items with both timestamps; otherwise it's shown as too small a sample.
- No-Throughput Days
- A count of the team's own configured working days within the sprint on which zero items closed — a day count, not an item count.
- Throughput
- Graded against its own trailing trend rather than a fixed number: at or above the median of the last up to six aligned sprints is on track; within 20% below is a caution; further below needs attention.
- Default goals
- Sprint Commitment ≥ 80%, Scope Delivered ≥ 95%, Net Scope Change within ±20%, P85 Cycle Time ≤ 7 days, No-Throughput Days ≤ 2. Every one of these is editable per team set — see Named team sets and goals.
- Sprint alignment
- The last 6 sprints, aligned by position — each team's own latest sprint under the chosen "as of" rule — not by calendar date, so a team on a different cadence isn't distorted to match another.
What you can click through to
- Every KPI tile opens a list of the exact items behind that number.
- Every per-team row in the three team-level panels opens that team's Sprint Summary.
- "SCC & scope change by team" has an "Export CSV ›" button — the only CSV export on this view.
Tip
P85 cycle time is deliberately never marked as something to celebrate while its sample is too small, however good the raw number looks.
Known limits
- Rolling several teams' figures into one set-wide KPI number is a judgement call, not a single obviously-correct method: counts are summed, ratios are weighted by their own numerator/denominator, and durations (P85 cycle time, no-throughput days) are a plain average across teams.
- No page-wide print or CSV export — only the "SCC & scope change by team" panel exports.
- A team set can hold at most 12 teams.